Bob’s Imaging Fundamentals #2: More LUT Tricks
Today I am going to show you a couple of other things you can do with a Look-Up- Table (also known as a LUT). You may recall from the previous article on LUTs, that a Look-Up-Table is a basically a list of numbers that can be used to change pixel values in some predefined way. For example, let’s say you want to increase your image’s contrast but you don’t want to use histogram equalization because you find the results look a bit too harsh and unnatural.
So, let’s start with an old family photo of Mr. Bug. If we look at the histogram of Mr. Bug’s photo, we can see that it is a low contrast image because all the pixel values are all smooshed into a narrow range between 20 and 125 (for those of you who are unfamiliar with Computer Vision technical jargon, ‘smooshed into a narrow range’ essentially means your image would have contained more information if uncle Charlie would have remembered to bring the flash!).

Obviously, our goal is to try and un-smoosh the pixel values such that we use as much of our available range of values as possible. So what we are going to do is build a Look-Up-Table that will effect a linear re-mapping of all available pixel values over the entire 8-bit range (i.e. 0 to 255). In other words, we are going to take 20 to 125 going in, and produce 0 to 255 on the way out, in effect, stretching the contrast of our image. Here is what our LUT looks like when drawn and tabled:
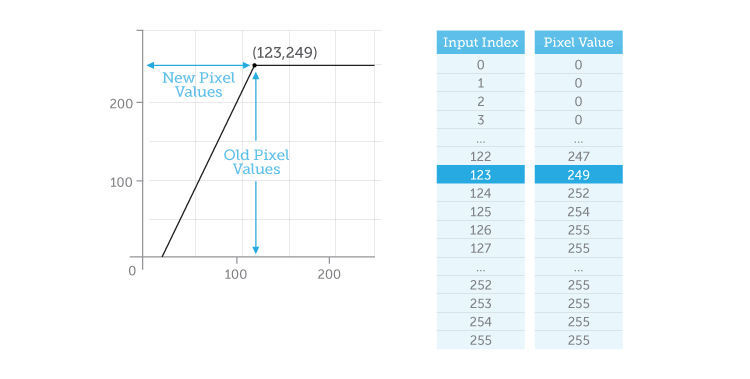
Notice how the pixel values from the original image come in on the X-axis at the bottom and are mapped to a new pixel value on the Y-axis according to the function we have plotted on our grab. So, what happens when we run Mr. Bug through our contrast-stretching LUT? We get a picture that is much brighter and better balanced:
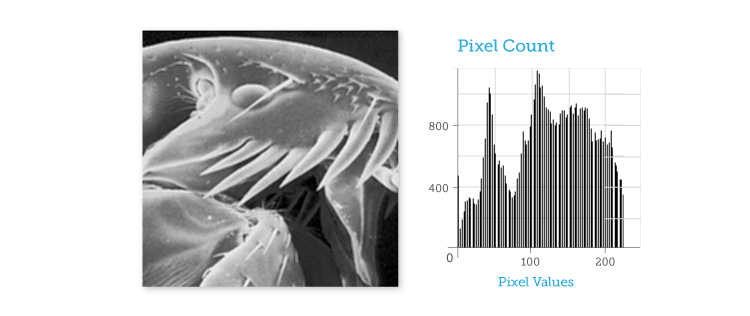
And, if we look at the histogram of the resulting image, we can see that the pixel values are now spread out over the usable range of pixel values. Now I’m sure some of you are wondering what I was talking about when I said that histogram equalization looked harsh and unnatural. So, for the sake of argument, here is equalized Mr. Bug and his histogram:
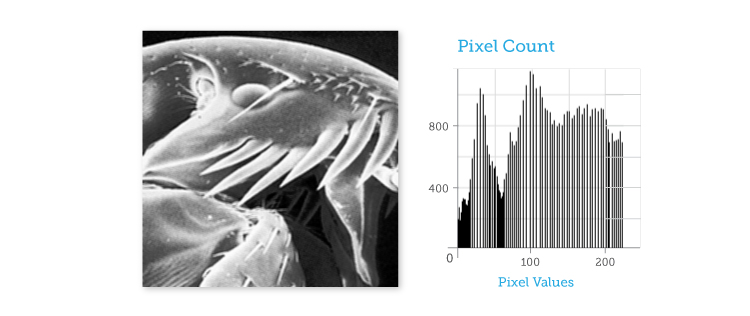
See how the equalized version looks more blotchy and extreme? This is because the pixel values have been shoved around in order to create an equal density in the histogram. And, although this does in fact increase contrast, it does not preserve the natural spread of pixel values the way a linear contrast stretch does. As always though, your choice of tools should depend on the needs of your particular application, so don’t be afraid to try different techniques before settling on a particular approach.
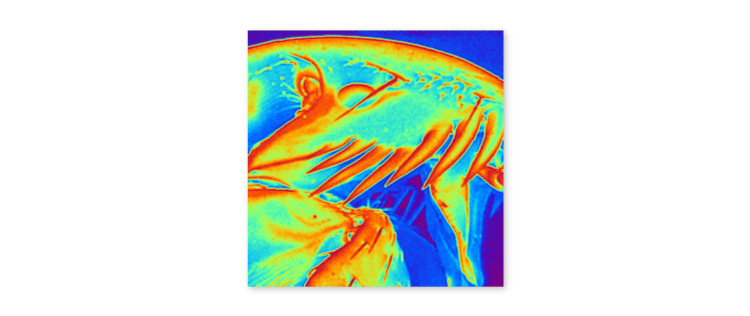
Next time, I’m going to show you how to use LUTs to make Mr. Bug look like this!
About this article: Bob’s Imaging Fundamentals is an article series based on the work of Bob Howison. Originally titled Bob’s Brain Snacks, these articles were intended to help employees and partners get up to speed with the fundamental concepts of image processing. They became such a popular reference that we’ve decided to bring them to the Possibility Hub. As technology goes further, faster, and new industries discover the power of digital imaging, it’s important to remember the basics.
Bob’s Brain Snacks are recommended for anyone interested in learning about imaging technology. Sharpen your mind and try one!



 Bob’s Imaging Fundamentals #1: Look-Up Tables
  When Can a Semi-Custom Vision System Help?