

Charting the Deep: Understanding Our Oceans, Envisioning Our Future
Most of the planet is covered by water, most of it deep ocean. Beyond the reach of everyday life and even most research, much of it remains a mystery. But increasingly, people are taking on that challenge using new imaging technologies that can give us a better understanding of our changing planet.
If the story of scientific progress is anything, it could be the story of blind spots. In the 1950s, the male-dominated scientific community was largely dismissive of women who, despite their hard-earned academic credentials, aspired to something more than secretarial work. So, to find a woman such as Marie Tharp in the annals of groundbreaking scientific discovery during that time is both surprising and inspiring.
Tharp, an American geologist, oceanographer and cartographer barely into her thirties, drafted the first comprehensive map of the floor of the North Atlantic in 1952, using data her male counterparts had gathered while crisscrossing the ocean over the previous decade.
Combining previously unrelated data revealed new truths. Her drawings led to the universal acceptance of an idea that was previously mocked: continental drift. It was quite an achievement for someone whose evidence-based arguments supporting the controversial theory were initially dismissed as “girl talk.”
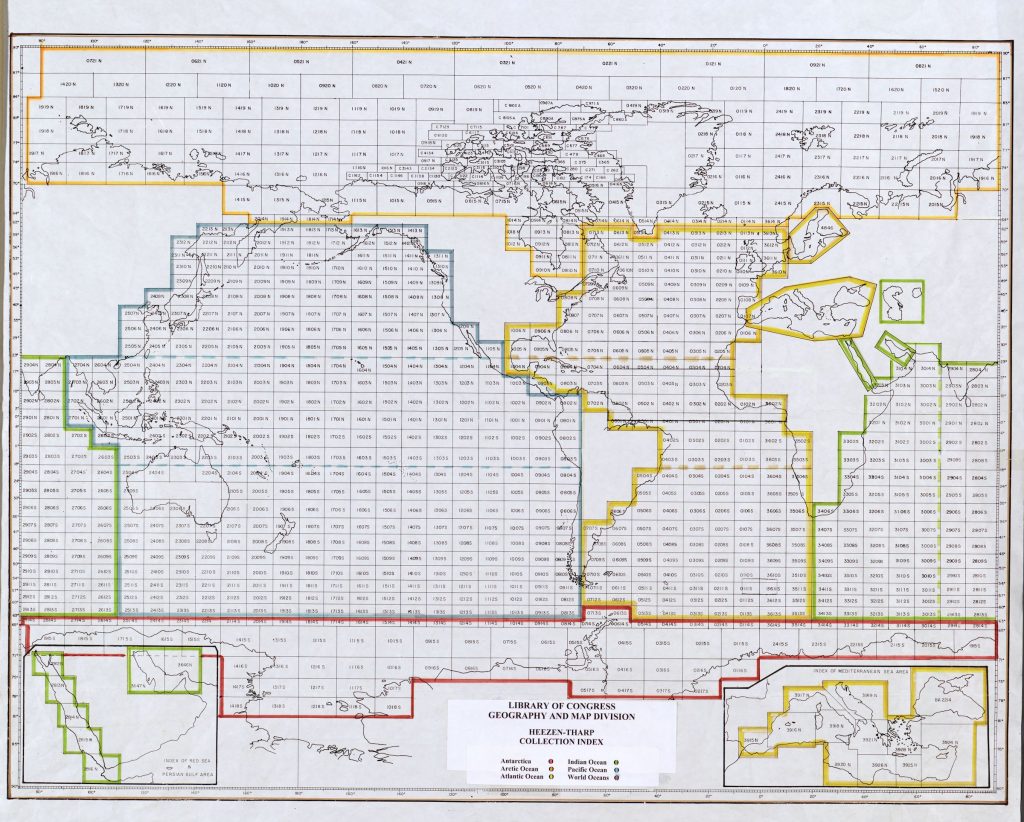
It took decades for Tharp’s work, which was uncredited at the time in deference to her male colleague Bruce Heezen, to be properly acknowledged. But what’s also striking today is that many of the challenges she and her colleagues faced at the time persist well into the 21st century.
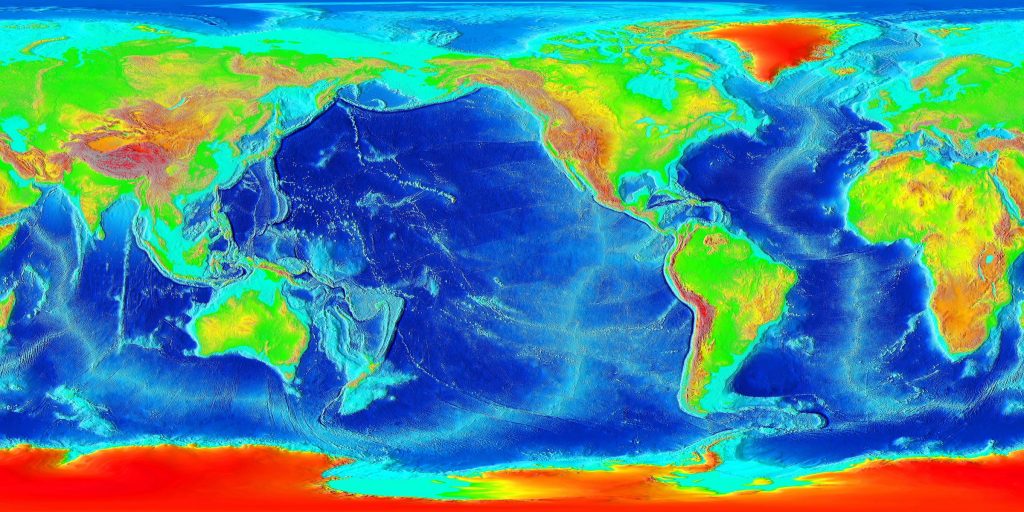
Fundamental bathymetric data of the Atlantic and elsewhere were fragmented in Tharp’s day. We’ve made only marginal improvements since. Indeed, it’s estimated that close to 80 percent of the world’s oceans remain uncharted. We know more about the surface of Mars, where clear evidence has been found to confirm that lakes and rivers of liquid water coursed across the surface billions of years ago, than we do about our own seafloors.
One reason we know so little about the world’s underwater topography is that, well, to put it simply, it’s hard to see. There is very little light down there, which makes it a dark and mysterious place.
But breakthroughs in bathymetric technologies and some ambitious goals to map more of the world’s lakes and seabeds are changing our understanding—and appreciation—of what covers the vast majority of the Earth’s surface.
Many reasons to explore
Just as we rely on topographic maps to provide a three-dimensional portrait of overland terrain, bathymetric maps are essential to our knowledge of the characteristics of land that lie underwater and out of sight. Nautical charts based on data acquired during bathymetric surveys are used to guide mariners and ensure safe and efficient maritime transportation, for example.
Bathymetric maps are also increasingly important as scientists strive to learn more about climate change and its effects on our environment. The information they convey is essential for seafloor structural construction, laying pipelines and cables, and tunneling, dredging and anchoring, but it’s also crucial as we come to grips with rising sea levels and receding shorelines. Scientists use bathymetric data to create hydrodynamic flood models that might literally save lives.
Those efforts are sometimes rooted in history. The Mona Passage between Puerto Rico and the Dominican Republic in the northeastern Caribbean, which was the site of a devastating earthquake and tsunami in 1918, provides one example. In 2007, the U.S. Geological Survey, Woods Hole Oceanographic Institution and the National Oceanic and Atmospheric Administration mapped in detail the seafloor under the waters of the passage to identify active faults and submarine landslides and to better understand their underlying causes.
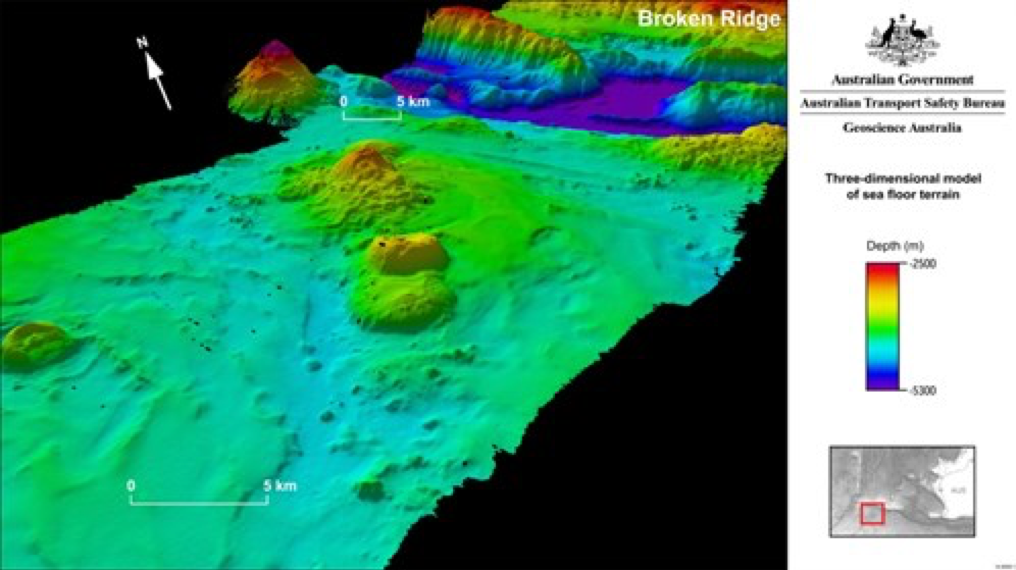
More recently, the Australian Transport Safety Bureau launched a seafloor mapping and underwater search for missing Malaysia Airlines flight MH370, which disappeared in the southern Indian Ocean while in transit from Kuala Lumpur to Beijing in March 2014.
There are many reasons why we might want to explore the oceans’ floors, so the question is this: what’s the best way of doing it?
Different ways to examine the oceans’ depths
For centuries, the most common method was through depth sounding. A weighted rope or cable was lowered over a ship’s side, and when it touched bottom the depth was calculated. But it was far from reliable. Movements of the ship and currents could easily put the line out of true and give results that were misleading.
Today, the data used to make bathymetric maps often comes from an echosounder—a sonar device mounted beneath a vessel—that “pings” the seafloor. The amount of time it takes for that ping to reach the bottom and return to the sounder is used to calculate the distance.
Starting in the early 1930s, single-beam acoustic sounders were introduced—in fact, much of the data that Marie Tharp relied on for her early maps of the North Atlantic was acquired using an improved version of that technology during the Second World War or soon after. Today, Multibeam Echosounders (MBEs) like those developed by Teledyne Marine, use hundreds of very narrow adjacent beams arranged in a fan-like swath, are more common and much more accurate.
Light detection and ranging—referred to as LiDAR, or alternatively lidar—is also used to gather bathymetric data in shallower areas. Rapid pulses of laser light are fired at a seafloor from an airborne platform, and a sensor measures the amount of time it takes for each pulse to bounce back. Teledyne Optech systems, operated by maritime and government agencies for more than 25 years, have evolved into a powerful multi-sensor suite that includes lidar to gather high-density bathymetric data.
In addition, a growing number of ways in which those technologies can be deployed is available. For example, autonomous surface vehicles (ASVs) and autonomous underwater vehicles (AUVs) can conduct acoustic surveys without input from an operator, while increasingly sophisticated unmanned aerial vehicles (UAVs) can be used for lidar-based systems.
New technologies and collaboration
Alongside ongoing developments in advanced hardware for marine surveying, geospatial software used to process raw bathymetric data is making new levels of resolution possible and leading to some surprising applications.
In 2015, Fisheries and Oceans Canada partnered with Teledyne CARIS and a Calgary-based geomatics technology innovation center to create the first 3D model of one of Sir John Franklin’s lost ships, HMS Erebus, which Parks Canada, together with the Canadian Hydrographic Service and Canadian Coast Guard, had discovered in the western waters of the Canadian Arctic the year before.
The model was produced using multibeam data collected by the Canadian Hydrographic Service and exported through CARIS software to create the detailed information required for 3D printing. After further refinements, completed high-precision models were proudly unveiled a year later.
The discovery of Erebus was made possible, in part, by summer sea ice that has begun to clear earlier than usual because of global warming. Not long after, Erebus’s sister ship HMS Terror was also located in the same turgid Arctic waters. Increasingly, the use of bathymetry will enhance our understanding of climate change.
Meanwhile, efforts to map the world’s lakes and oceans are pushing marine and bathymetric technologies to even greater extremes.
Seabed 2030 is an ambitious joint project between the General Bathymetric Chart of the Oceans (GEBCO), an international group of geoscientists and hydrographers who work on the development of a range of bathymetric data sets and data products, and the Nippon Foundation. Together, they are working toward the focused goal of producing a definitive, high-resolution bathymetric map of the entire ocean floor in just over a decade.
GEBCO, which operates under the joint auspices of the International Hydrographic Organization and UNESCO’s Intergovernmental Oceanographic Commission, also hosts an annual Map the Gaps symposium, for which Teledyne CARIS is a proud sponsor, to discuss “innovative technologies and approaches that are pushing the boundaries of ocean floor mapping.”
An endeavor that’s similar to Seabed 2030 is led by the Great Lakes Bottom Mapping Group, which is focused on collecting continuous high-resolution floor data for the Great Lakes and their connecting channels.
Altogether, the pace of exploration and discovery is accelerating. So, too, is collaboration and even competition, such as the $7M Shell Ocean Discovery XPRIZE. The winners in that global contest were announced at an awards ceremony in Monaco in May 2019, with the top prize given to the 14-nation GEBCO-Nippon Foundation Alumni Team in recognition of its novel application of integrated technologies to enable rapid seabed visualization.
But with that, there is also a growing need to reconsider how bathymetric data should be managed, especially as its volume increases significantly and new maritime services such as e-navigation, a foundational piece for autonomous shipping, are on the horizon.
 “The World Isn’t Flat, It’s Panoramic”
  How LIDAR is helping to clean up our oceans