

How Researchers Use Lidar To Monitor Rockslides
Aerial and terrestrial laser scanning have become the go-to methods for researchers to monitor unstable ground.
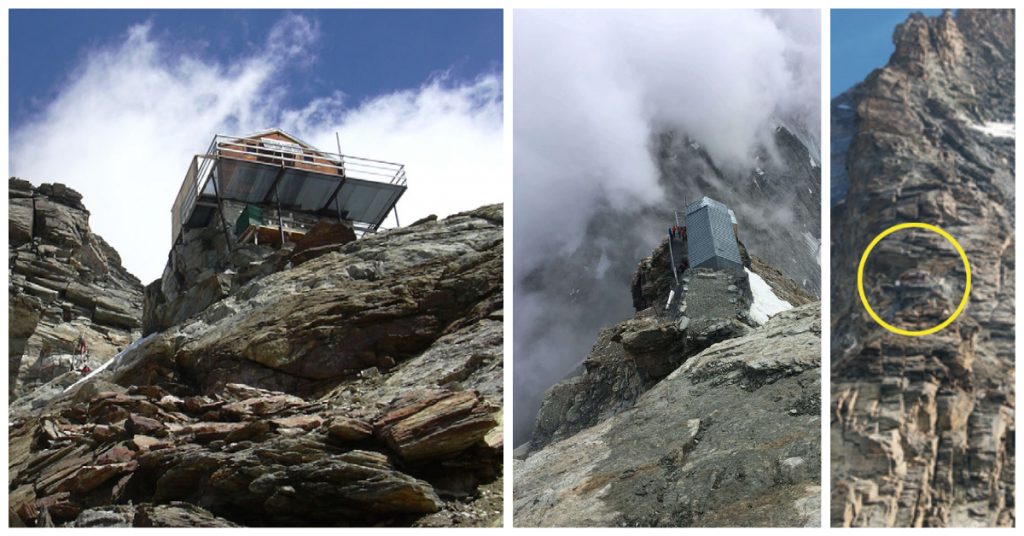
Knifing into the sky at almost 4,500 meters above sea level, Matterhorn is an enticing challenge to mountain climbers everywhere. Located in the Alps on the border of Switzerland and Italy, climbers typically approach the ascent to the summit from the south-west ridge from a small building called Carrel Hut situated on a cliff. But as the permafrost on Matterhorn melts, the rock mass of the cliff has weakened, sometimes leading to rock falls that can be hazardous to climbers on the route.
Monitoring rock formations to predict land or rockslides used to be the work of manual inspection, climbing a mountain or a hill to determine its stability. Photogrammetry—the use of photography in surveying and mapping to measure distances between objects—can be used to create 3D data sets, but it’s a cumbersome process that requires shooting from a variety of angles and then splicing the images together. Scientists have instead started employing laser scanning to provide robust and precise data sets that give more comprehensive views of land formations and how they move over time.
Light detection and ranging, known as lidar, is a simple concept. A light source, such as a laser, is beamed in the direction of an object (in this case, a mountainside). The light is reflected and captured, allowing measurements of that object to be made (sonar works in the same way, but uses sound waves instead of light). The two main categories of lidar used for mapping and monitoring landslides are aerial laser scanning (ALS) performed by planes, helicopters or unmanned drones, or terrestrial laser scanning (TLS), done from the ground.
Over the last 20 years, terrestrial laser scanning has become the preferred method of monitoring and mapping rock formations at Matterhorn and elsewhere, providing the most precise measurements available to scientists.
Head in the Cloud Points
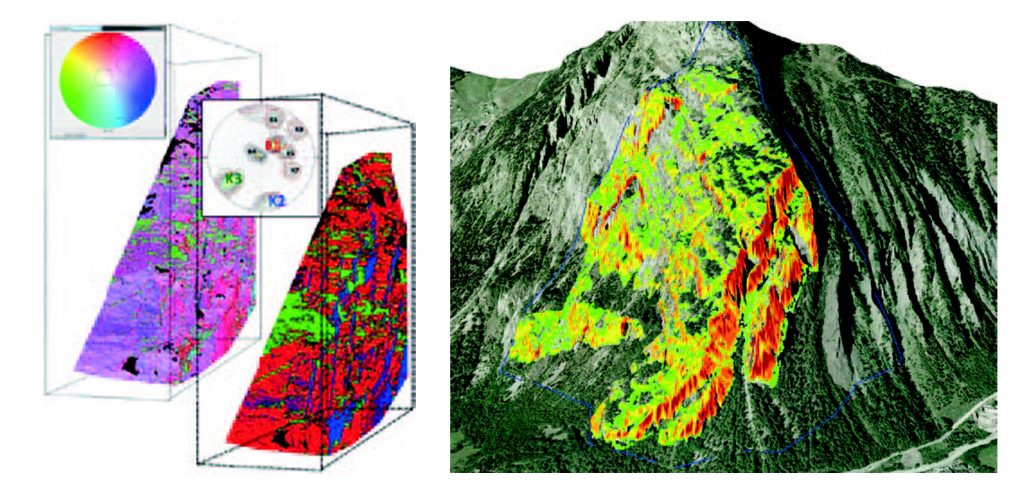
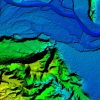
When lidar is used to measure an object, the data is returned in the form of 3D dots called point clouds. ALS is most often used to give scientists a broad overview of an area of rock and land formations, providing a resolution of between 0.5 and 50 points per meter squared. TLS can be much more precise with a resolution of 100 to 500 points per meter squared.
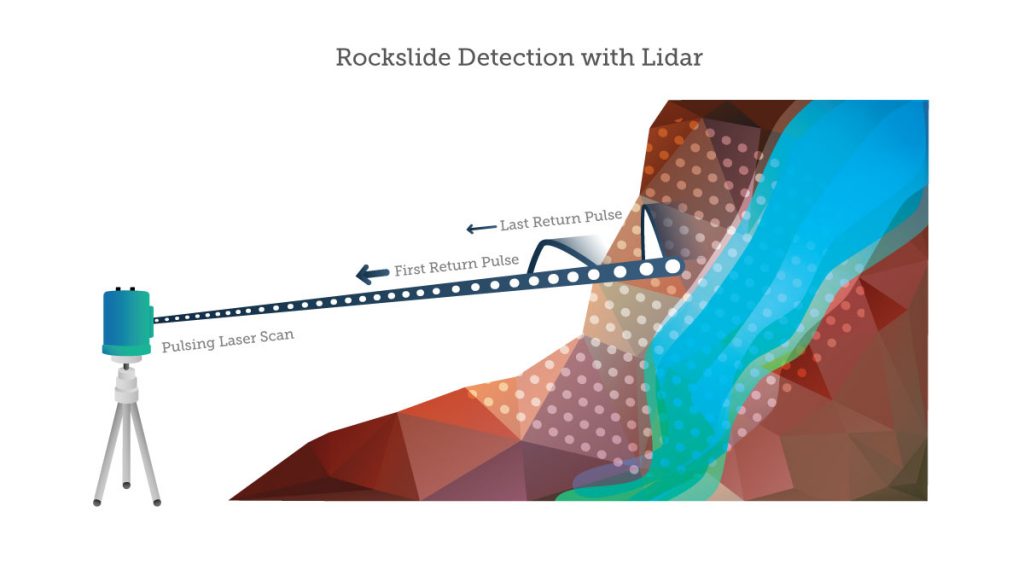
Point clouds can be converted to surface data, usually through a method called Delaunay triangulation. The results are maps called high-resolution digital elevation models (HRDEMs) that are the primary tool in analyzing rockslides.
According to Michel Jaboyedoff, professor of the Institute of Earth Sciences at the University of Lausanne, the primary uses of lidar in landslide investigations include:
- Detection and characterization of mass movements
- Hazard assessment and susceptibility mapping
- Modelling
- Monitoring
On Matterhorn, researchers set up a Teledyne Optech terrestrial laser scanner 400 meters away from the unstable area around Carrel Hut. From there, they can monitor the “geometric discontinuity” of the slope with a high degree of accuracy.
Monitoring Unstable Ground
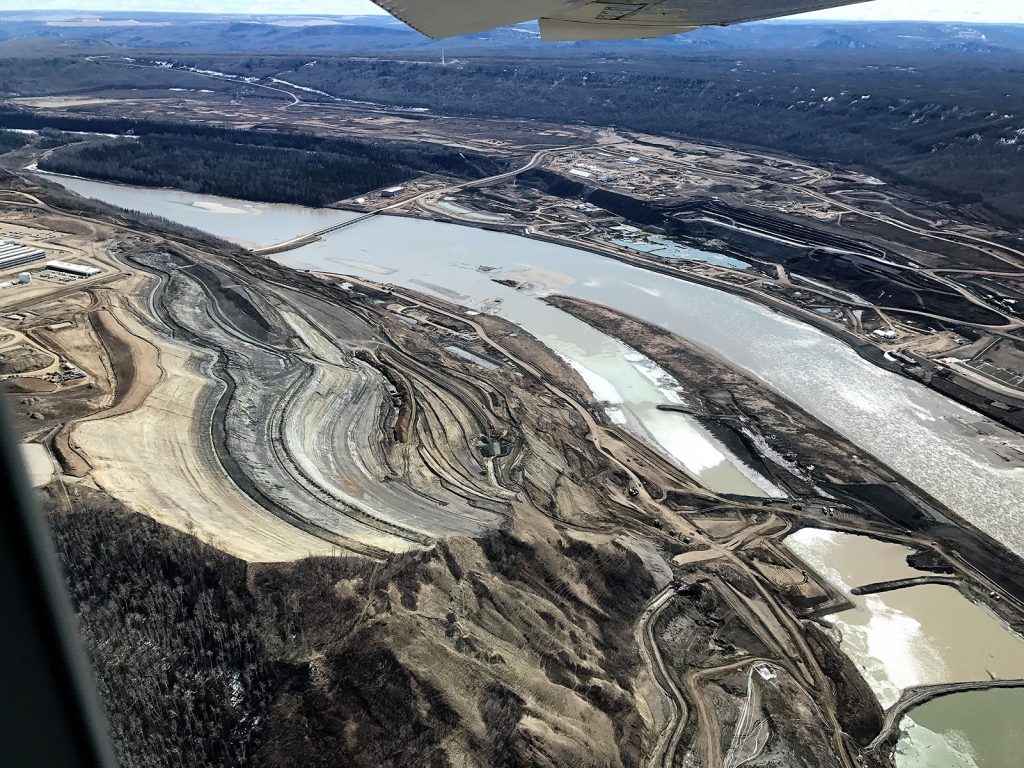
Surveyors at the Site C hydroelectric dam project on the Peace River in northeast British Columbia use TLS to monitor and assess the banks of the river as the dam is constructed. The dam will create an 83-kilometer long reservoir when its finished, which will significantly affect the local landscape. The area is geologically active after the last two periods of glaciers moved through the valley, leaving a variety of sediment layers, some of which are weak. Over the years, the river has cut through these layers, creating large slopes and cliffs that are prone to movement.
The entire 750-kilometer square area around the reservoir has been scanned from the air using lidar twice, once in 2006 and again in 2015. These datasets gave engineers a good overview and allowed them to see where major slope movement had occurred in the intervening years. To keep the dataset up to date, the engineers survey the region twice a year in the spring and fall (to avoid leaves on trees and snow on the ground that could interfere with measurements). These scans are performed with Teledyne Optech’s Polaris.
Scanning such a large area from the ground is a daunting project. Engineers identified 10 slopes spread throughout river and construction area that required special attention. Some of these areas are hard to access and require specific angles and multiple locations for the scanners to attain an accurate measurement. Engineers chose the Polaris-LR because it provided the longest range and allowed the team to set up in more convenient locations from the target slopes. In experiments, the engineers found that the Polaris could provide good results at a distance as far as 2,000 meters in good conditions. With a couple swappable batteries, survey teams can hit multiple locations per day as Polaris needs about 30 to 45 minutes to scan each location.
Once the survey is concluded, the cloud points are parsed using Optech’s ATLAScan software [PDF] and downloaded to compare with previous data. Engineers are looking for “areas of loss (where the elevation of the slopes has been reduced) and deposition (where the material has increased)” that indicate where rock or landslides or construction activity has occurred. The change in landscape from survey to survey is not always obvious, which means the teams need a high degree of precision. The Polaris allows the team to collect data with tight point spacing, with five to 10 centimeters separating adjacent points, and three to four centimeters spacing for the most critical areas.
Lidar is the Present and Future of Landslide Monitoring
It’s become clear to researchers, surveyors and engineers that terrestrial laser scanning with lidar instruments is the future of slope monitoring, mapping, and characterization. TLS allows for the most flexibility when taking measurements, and the biggest and most precise datasets for analysis.
“The current knowledge concerning the mapping and monitoring of landslides is now far beyond what was expected by the end of the nineties,” Jaboyedoff wrote in a 2018 paper. “This is mainly due to the recent advances in remote sensing techniques (including lidar), together with the exponential growth of computational capabilities.”
 Lidar and natural disasters
 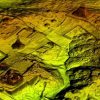 Discovering Cities: Lidar Past, Present & Future