

The real world benefits of automation: A hydrographer’s story
The surveying industry is constantly changing and updating, with new technologies and improvements to existing ones.
Coming from a background in ICT and software design, I have always been surprised by the amount of knowledge—specifically IT knowledge— that today’s hydrographic surveyor needs to ensure that a survey is successful. This is especially true with vessels of opportunity, when a rented or short-term multibeam system needs to be installed and validated. All while a timer is hanging over you and counting down to when the vessel moves onto the next job. From dealing with hardware settings, IP addresses, the ever-trustworthy Windows firewall and my personal favorite, ‘why couldn’t that VGA cord be a foot longer?’, the challenges of prepping for the field are numerous. And, unfortunately, they do not always end there, and continue through into data processing, interpretation and presentation. More often than not, our time is hijacked once we are ‘back on shore’ and the data processing phase—equally as important as the collection stage—is plagued with conflicting priorities.
Learning, perhaps the hard way, I am now a strong believer in achieving as much as possible while onsite, and even better, while on the water. This is especially true for a surveying contractor who will move from site to site, and often great distances. The possibility of having to remobilize and repair missing coverage or bad data is often not possible logistically or financially. There is also the often-un-accounted cost of repairing a survey, meaning not only the cost of repair, but also the delay and schedule push back for the next survey in the pipeline.
I had found our previous acquisition/processing software solution to be the ‘Swiss Army knife’ of software suites, essentially allowing me to turn up on location and source any piece of equipment and have enough tools and drivers to pull a survey together. But with all that flexibility it is hard to accelerate the field-to-finish workflow, and introducing new team members can be a daunting learning curve for both them and me.
Injecting Automation
A few years ago, we transitioned to CARIS HIPS & SIPS for our processing, as our other dongle was tied up in the field. We could no longer wait till the end of the acquisition stage before moving to processing. Certain features have proven invaluable, such as Process Designer, which allows the operator to automate the import of field data and output deliverables. For our repeat surveys or dredging projects, setting up a reference model has been a huge benefit in computing volumes and the time it takes to present results.
However, something was still missing. I had a survey workflow that seemed to hit a bottleneck somewhere, and it just seemed impossible to shorten the field-to-finish timeframe. And with the significant costs associated with multibeam sonars and navigation systems—let alone vessels—nobody can afford to have them sitting idle on deck while project processing keeps the team office bound and not on the water.

The Missing Piece
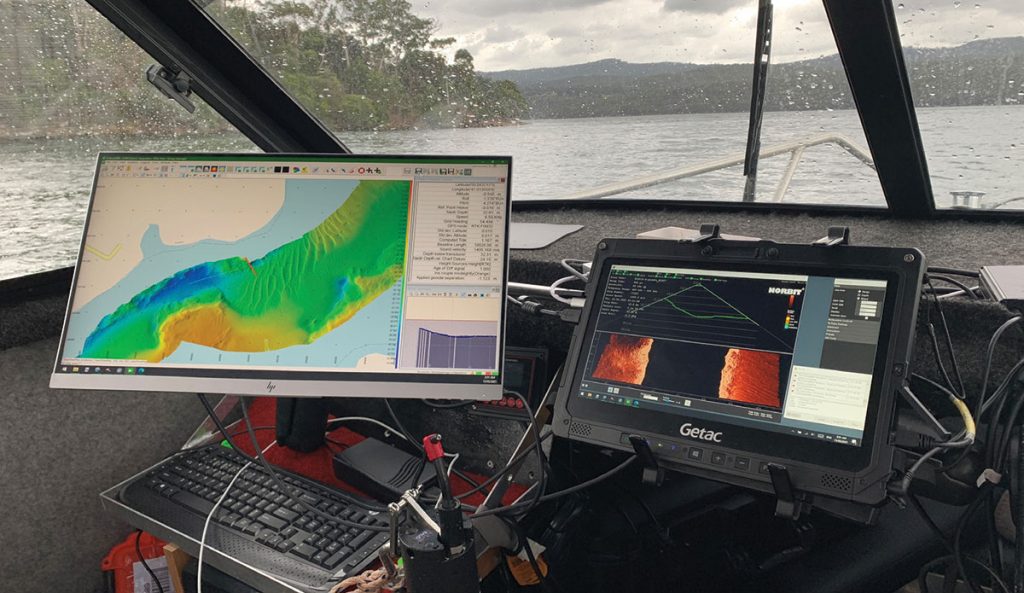
Enter CARIS Onboard360, which has really transformed our overall survey experience. CARIS Collect, the acquisition module, supports all the sensors we are currently using—Norbit, Velodyne, Riegl etc.—and the hardware setup is clean and straight forward. Being able to have multiple configurations, effectively in a dropdown list, allows us to setup a survey with bathymetry only, bathymetry and topside LiDAR, or snippets. This way we are not logging unnecessary data or dealing with device timeouts when not using the extra equipment. The survey setup is uncomplicated and adds convenient options such as web map backgrounds and background layers to your coverage map.
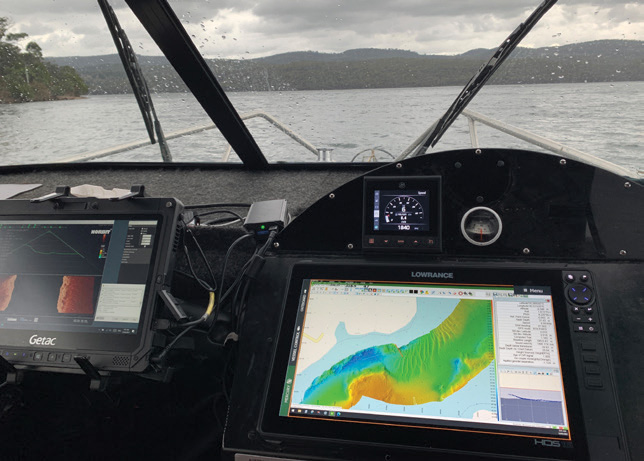
Stepping onto our survey vessel and plugging the laptop into the docking station, the workflow is perfectly intuitive: start CARIS Process to monitor for logged data, start the sonar GUI and launch CARIS Collect. With predefined screen layouts, the acquisition module is a joy to use. Built on Teledyne PDS, the survey coverage grid is the best I have used—responsive, scales to large surveys, and has lots of customization of track history and background layers. You can have as much or as little information as you like, and the amount of detail you can display on the incoming sensors is excellent. The guidance editor for creating run lines is second to none, allowing you to add cross lines quickly and automatically. The software has some great online multibeam filters which can read in real-time uncertainty and filter points not meeting IHO standards.
Now where the fun begins: once a survey line is logged, CARIS Process picks it up and starts the process model designed back in the office. The model takes the raw files, applies the sound velocity drops I have been saving to a folder, geo-referencing the data to the horizontal and vertical datum the client needs. From there, via the cellular connection in the laptop, the data is sent to the CARIS Mira AI cloud noise classifier, and every data point is assigned a confidence. A final CUBE raster surface is created or updated, which can be viewed in a web- browser by people onboard the boat or onshore for that matter. The data upload is efficient enough that we are yet to have problems using the noise classifier over a 4G hotspot connection.

Data sharing
Having the ability to stream a processed product off the vessel opens the potential for a harbor master, or the client, to monitor the progress (and therefore offer input) of the survey in real time. Based on the data coming in, for example, that person would be able to directly communicate with the field team to advise of any necessary adjustments to the survey area.
Most clients are unable to handle traditional file formats, like point clouds; the datasets are just too large, and they cannot justify the required investment in specialized software. There is only so much value you can immediately share through PDF’s, DXF’s, and ASCII files, and the problem of losing metadata with these methods can trigger all sorts of downstream issues. In addition to the real- time streaming, being able to deploy CARIS Easy View, a free 2D/3D viewer, to our clients is such a huge advantage; it allows them to interrogate, QA/QC, and extract information from our data, and outputs of the engineering analysis more effectively than ever before. Being able to share the native processing formats with our clients immediately eliminates any unnecessary time and frustration (on both parts) spent in educating users how to manage the data they receive.
Custom Development
Teaming up with the University of Tasmania, we were able to develop our own custom code. Leveraging the Process Designer, to output a point cloud, our code critiques the exported point data and generates a background image that shows where the survey is non-compliant for line overlap and sounding density, based on what survey standard is chosen. This background image and waypoints to the areas of remediation are then loaded into the data collection software and shown on the helm display so the surveyor can navigate straight to them. Even better, the waypoints are designed with a least-cost path algorithm so following the waypoints in order results in the fastest route to fill in gaps in survey coverage.

End-to-End Solution
With the release of Onboard360, we now have a complete end-to-end CARIS solution which
covers our full workflow from data collection to delivery. The Onboard360 suite combines simple
and effective data acquisition tools with workflow efficiency and timely quality information provided by real-time automated processing. When coupled with the CARIS Mira AI noise classifier, a nearly complete project (both acquisition and processing) is ready when I leave the vessel, finally providing a real-world solution for shortening the field-to-finish timeframe. On top of this, the streaming of a processed product on the vessel enables in-field confirmation that the project requirements have been met, avoiding any costly remobilizations. Streaming off the vessel allows the client to looping feedback and adjust the survey there and then.
By staying in the CARIS ecosystem, the project from the vessel can be directly opened in HIPS and
SIPS for post processing, or in Easy View for client deliveries, preventing any clumsy and timely data transition stages.
Survey teams are always under pressure to deliver projects faster. The only solution is to identify
ways to optimize your whole workflow. The CARIS ecosystem has proven to be instrumental in
making this happen.
 Safe Water: Hydrography Embraces the Autonomous Age
  The One-Source Solution