

Safe Water: Hydrography Embraces the Autonomous Age
New S-100 mapping standards will make shipping safer, faster, and more automated
As a young man, Samuel Langhorne Clemens worked as a steamboat pilot on the Mississippi. As part of the job, he had to learn the peculiarities of the river, such as whether a ripple on the water was just the wind or a dangerous reef hiding just below the surface.
According to the Ken Burns documentary on his life, Clemens would, “learn to note the depths at every crucial spot, where the leadsmen dropped their knotted rope lines and sang out their measurements. Quarter twain, half twain. And the most pleasant sound of all to a pilot: mark twain. Meaning, two fathoms, or twelve feet. Safe water.”
For a riverboat pilot, two fathoms was the point where dangerous water became safe, or safe water became dangerous. And so the most celebrated author of American literature took his pen name—Mark Twain—from bathymetric data.
Hydrograpy—the science of mapping the seafloor—is often a matter of life or death. The world’s oceans, lakes and rivers can be hazardous places to work. Commercial seafaring is considered to be the second most dangerous occupation, with 2,000 fatalities per year, behind only commercial deep-sea fishing. On average, more than two commercial ships are lost a week, a figure that doesn’t count smaller vessels or fishing craft. Of the listed shipwrecks in 2019, at least 30 of them ran aground.
Still, shipping remains the most important method of trade and transport in the world. According to the United Nations Conference on Trade and Development in 2018, “around 80 per cent of global trade by volume and over 70 per cent of global trade by value are carried by sea and are handled by ports worldwide.”
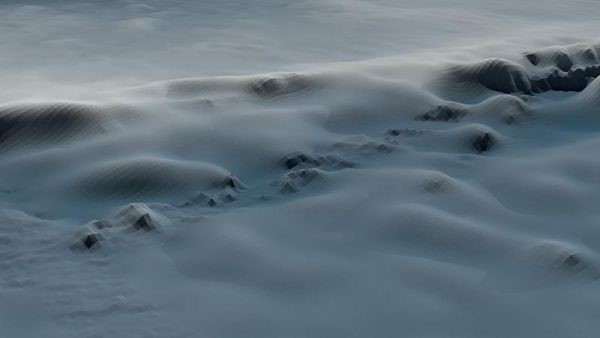
But the world’s waterways are unpredictable and perilous, filled with undersea mountains, rivers, ridges, and canyons. And they remain almost completely unknown: humanity has mapped the surface of the moon in more detail than the bottom of the Earth’s oceans. According to the United States National Oceanic and Atmospheric Administration (NOAA), the world’s oceans cover about 71% of the planet’s surface, about 362 million square kilometers. Despite centuries of bathymetric readings, only a fraction of the seafloor has been directly measured using echo-sounders with a resolution of one kilometer.
NOAA states that, “high-resolution seafloor mapping is a critical tool for regulating underwater resource exploration, extraction, and equipment, allowing us to decide what and where is safe. Seafloor maps also ensure that ships are able to safely maneuver around natural—and human-made—structures on the ocean bottom.” But how will the daunting task of mapping the world’s oceans be accomplished?
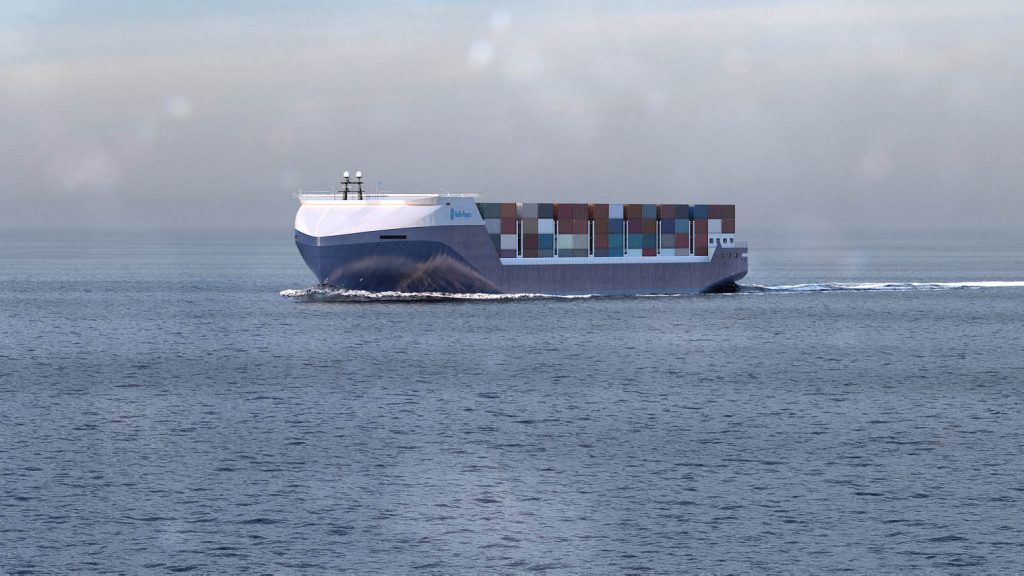
The new technologies for mapping, and automating the way we map and navigate our waters will play a pivotal role. Robots, autonomous systems, and artificial intelligence will lead the way to help solve a problem that has existed since the beginning of human history.
The History of Measuring the Depths
Bathymetry is the foundation of hydrography, the science of surveying and charting bodies of water. Bathymetric measurement has a long history, beginning more than 3,000 years ago when the ancient Egyptians mapped the water depth of the Nile river, the center of their religious, political, and commercial life. All things flowed through the Nile, and it was vital to learn everything about it.
The use of rope lines to take bathymetric readings in rivers, lakes and oceans would persist until shortly after Twain died in 1910. It then gave way to measurements performed by sound waves, spurred by the search for the remnants of the Titanic in 1912, and submarine warfare in the North Atlantic in World War I.
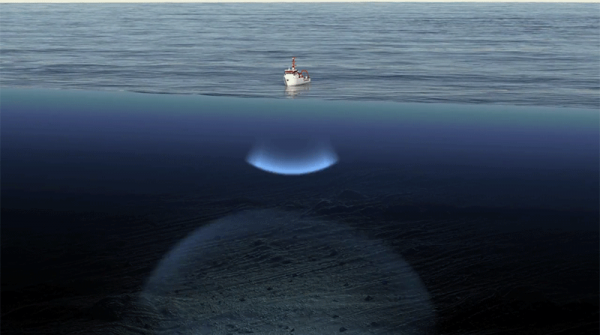
Bathymetry measured with ropes and weights was eventually replaced by echo-sounders, electronic instruments that pinged sound waves off the ocean floor. The first of these sounding devices were known as “single beam echo-sounders” (SBES) that were attached to the bottom of boat, “configured with piezoelectric crystal- or ceramic-based transducers that generate and receive acoustic signals. The depth of the seafloor is determined by measuring the two-way travel time of a sound wave that is sent toward the seafloor and back.”

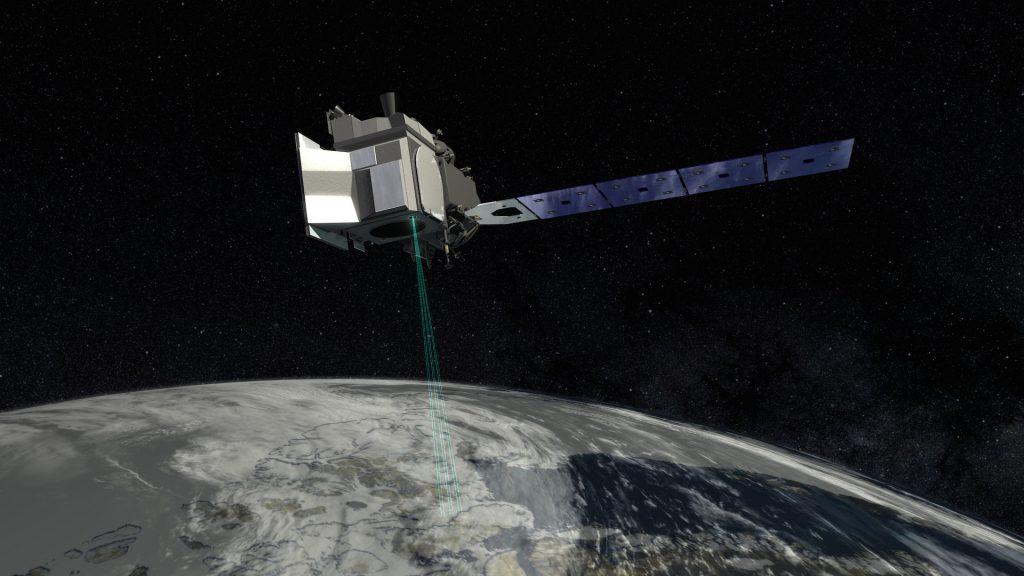
SBES devices were the primary means of taking bathymetric readings until the 1970s. The maturation of the Space Age allowed scientists to use satellites to help measure ocean depths as techniques known as “satellite-derived bathymetry” (SBD) and “satellite altimetry” came into use.
SDB works as, “satellite platforms collect data in multiple spectral bands, spanning the visible through infrared portions of the electromagnetic spectrum. Water depth estimations are based on the attenuation of radiance as a function of depth and wavelength in the water column.” SDB was limited in its use, as it was only really useful in shallow coastal areas with clear water.
Unlike echo-sounders, satellite altimetry does not directly measure the ocean depth, but rather the height of the ocean’s surface. The surface is affected by a variety of factors, including the “gravitational effects of topographic features on the seafloor.” Satellite altimetry is an imprecise method of measurement, able to only reveal horizontal features on the seafloor at the resolution of six to nine kilometers in the deep ocean.
SBES devices began to be replaced in the 1970s with multibeam echo-sounders (MBES), which work in conjunction with GPS satellites to give more accurate readings than most other methods.
According to oceanic researchers, “Multibeam systems radiate a fan of sound and listen to the returning echoes of the emitted signals in narrow sectors perpendicular to that fan, resulting in the mapping of a swath of seafloor instead of just a line. They have the advantage of collecting higher-resolution bathymetric data and of making mapping efforts much more efficient, by mapping an area in a much shorter time compared to SBESs. Modern systems can have many hundreds of beams and can achieve swath angles between 120 and 150 degrees.”
More recently, techniques such as light and laser detection and ranging (lidar) have been used to measure water depths. These work in a similar way to echo-sounding in that the light is projected into the water from an air-based platform and measurements are made by the light that returns . Lidar is only effective in shallow and extremely clear waters, but even within those limitations there are many useful applications. For example, The Ocean Cleanup used Teledyne Optech’s CZMIL Nova imaging system to help map six thousand square kilometers of the Great Pacific Garbage. The system’s suite of image and data collection instruments, including its high-power bathymetric lidar, RGB camera system, and a SWIR (Short-Wave Infrared) sensor allowed it to capture high resolution imagery of the underwater ‘islands’ of microplastics that are invisible to satellites.
Bring in the Robots
Seabed 2030 is an international project to “bring together all available bathymetric data to produce the definitive map of the world ocean floor by 2030 and make it available to all.” A collaboration between Nippon Foundation of Japan and the General Bathymetric Chart of the Oceans (GEBCO), the project is an outgrowth from Goal 14 from United Nations Ocean Conference in 2017 that aims to conserve and sustainably use the oceans, seas and marine resources.
Directly mapping the entire ocean floor and making the data universally accessible within a decade is a monumental task. The goal is to accomplish something within 13 years that has been unachievable in the previous 3,000 years.
This is where the role of automation becomes clear.
Echo-sounders have historically been deployed from the bottom of ships (such as research vessels or in cooperation with domestic fishing fleets) operating at the ocean’s surface. Ships are expensive to maintain and often cannot obtain high resolution data of deep water (classified as more than 200 meters in depth). In the near future, it is possible that much of the work in mapping the seafloor will be done by robotic systems. Marine robots have the ability to function without human crews, while storing and transmitting data to cloud computers for processing and analysis. Unmanned underwater vehicles (UAVs), unmanned surface vehicles (USVs), and remotely operated vehicles (ROVs) have the ability to go more places and obtain higher quality data than ship-based mapping.
The power and potential of marine robots for seafloor mapping was on display during the Shell Open Discover XPRIZE competition that concluded in 2019. Teams from around the world deployed air- and sea-based drones and robotic systems to attempt to map the seafloor at a resolution of five meters. The winning team—GEBCO NF Alumni Team, based out of the University of New Hampshire—deployed a dual system of two robots, one on the surface, one underwater, to map an area of 250 square kilometers while 4,000 meters under the surface within 24 hours. The surface vehicle (called SEA-KIT) provided housing for the UAV (called Hugin) and communications to the shore. Hugin was equipped with a Kongsberg HISAS 1030 system, a “new high-technology interferometric synthetic aperture sonar,” that could take high-resolution readings of the seafloor.
In the coming years, the global hydrographic community will deploy a variety of methods to accomplish the task of mapping the entire seafloor by 2030. Robotic systems with MBES and lidar equipment will be combined with crowd sourced data from ships as well as satellite technology to gather as much data as possible.
Harnessing Software, Artificial Intelligence, and the Cloud
Data collection from ships, satellites and autonomous systems presents unique physical challenges. And what happens to that data once it’s been collected? The world is a big place and Seabed 2030’s stated goal to “bring together all available bathymetric data to produce the definitive map of the world ocean floor by 2030 and make it available to all” is an especially exciting challenge from a data science perspective.
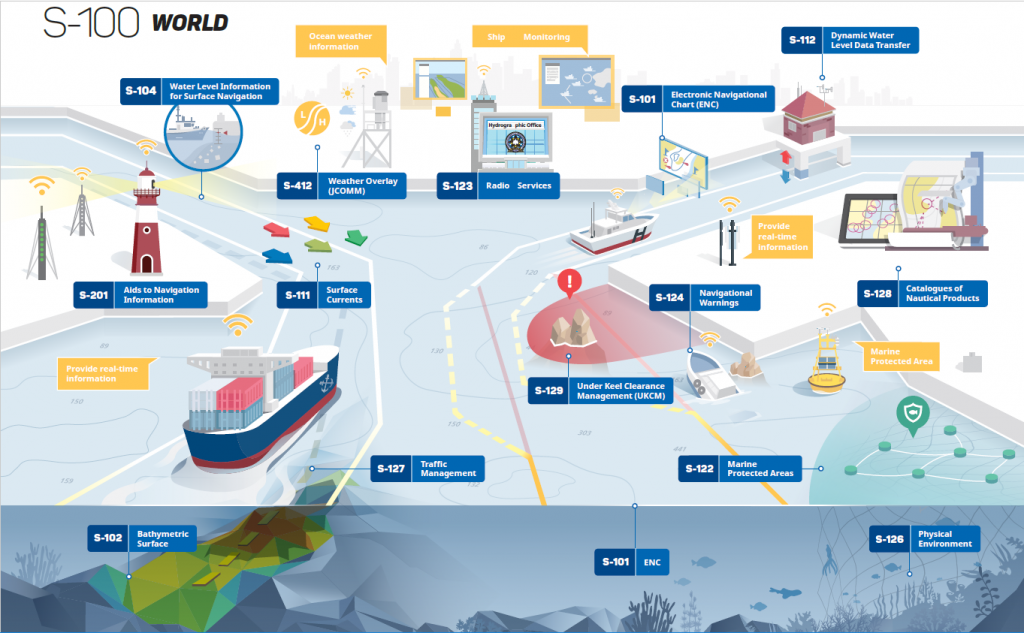
The International Hydrographic Organization (IHO) developed a new standards framework called S-100 to define products for navigation and other marine activities. Products include navigational charts, surface currents and water levels. The product specification that concerns bathymetry is S-102 with a focus on delivering high resolution data to the mariner. Bathymetry also provides the basis for many applications in the oceanic research, mapping, and exploration communities.
Teledyne CARIS develops software and databases to process, analyze and manage bathymetric data from sonar and lidar systems, and creates products that conform to the IHO S-100 standards. For instance, CARIS Onboard applies automated processes to bathymetric data in near real-time, resulting in minimized data conversion and processing times. Large volumes of data are automatically imported and the company’s trusted HIPS and SIPS algorithms are applied. Bathymetric data can be stored, analyzed and configured within the CARIS BASE Editor and the Bathy DataBASE Server, and then used in the production of high-resolution S-102 products and S-101 Electronic Nautical Charts (ENCs).
Analyzing hydrographic data is a perfect use case for modern artificial intelligence. AI works best when it has large datasets to work with, especially in the realms of image and video processing. Deep learning and machine learning—both subsets of artificial intelligence—is deployed in the CARIS Mira AI platform. Built in the cloud on Amazon Web Services, CARIS Mira AI provides capabilities across three dimensions: one-dimensional time series, two-dimensional grids, and three-dimensional clouds.
MBES readings are modeled into what are known as point clouds, creating an image that represents the seafloor. This sensor data can often be noisy and needs to be cleaned before it can be used. Cleaning data manually is time consuming and prone to human error. One practical application of artificial intelligence is to automatically clean the sonar data. CARIS’s Mira AI platform offers a service called the Sonar Noise Classifier, a convolutional neural network optimized to identify noise in 3D point clouds generated by acoustic sensor platforms and output a clean bathymetric data grid. The clean datasets can then be uploaded to the cloud and distributed securely.
The enormity of the ocean has inspired some of our biggest accomplishments but never fails to make us feel small. In his book Following The Equator, Mark Twain stated: “It is easy to make plans in this world; even a cat can do it; and when one is out in those remote oceans it is noticeable that a cat’s plans and a man’s are worth about the same.” But humanity loves nothing more than taking on seemingly impossible tasks. For the first time in history, we may have developed the tools that will make it feasible to achieve what was long thought impossible, understanding the oceans and making them safer to navigate.
 Charting the Deep: Understanding Our Oceans, Envisioning Our Future
  How LIDAR is helping to clean up our oceans