Mapping the Catalan coast using airborne Lidar bathymetry
A vital step towards effective coastal zone management
As part of a Catalan government project to improve the management of its marine environment, ICGC cooperated with Field to use airborne Lidar bathymetry (ALB) to survey the Catalan coastal zone. The result was an accurate, detailed topobathymetric elevation model, which will serve as a baseline for effective coastal zone management.
The Catalan coastal zone is vital for biodiversity and human activities such as tourism, fishing and aquaculture. The Catalan government is therefore producing a ‘Map of the marine habitats of Catalonia’, which will provide an accurate cartography of the Catalan seabed at the bathymetric, geomorphological, sedimentary and ecological levels, revealing the various habitats and species and their extent and distribution.
This knowledge is essential for good planning and management of the Catalan marine environment. It is particularly relevant in the context of protected marine areas of the Natura 2000 network and compliance with EU directive 92/43/EEC on the conservation of natural habitats and wild fauna and flora.
The acquisition of accurate bathymetry up to 50m depth is the backbone of this project. While the 10–50m depth area was surveyed using ‘traditional’ sonar technology, the Cartographic and Geologic Institute of Catalonia (ICGC) chose to survey the area from 50m inland to 10m water depth using ALB.
Suitability of airborne Lidar bathymetry
ALB uses laser light to measure water depths from an airborne platform such as an aircraft. It is usually used to map relatively shallow water bodies such as coastal zones, rivers and lakes. ICGC chose ALB because it is a mature technology that is notable for its accuracy, speed and cost-effectiveness. It also has the unique ability to simultaneously map both underwater depths and topographic elevations on land, creating a seamless elevation model of the coastal zone.
This transition zone between land and water is difficult to survey using other technologies such as multibeam sonar, as shallow areas can be inaccessible or dangerous to navigate. Sonar technology is also ineffective in shallow areas as the sonar swath width becomes very narrow, so that it takes a long time to survey the area. With ALB, it is possible to fly over an area with a swath width of about 300m at around 250km/h, which is much more effective.
While ALB is a niche market in the hydrographic survey industry, demand is growing due to an increasing global need for better coastal zone mapping, for environmental and economic reasons.
Field sensor and equipment
Through a competitive tender process, the Norwegian geodata collection and analysis company Field was chosen to execute the project. Field is specialized in ALB surveys and is the only European company to use the advanced CZMIL SuperNova bathymetric Lidar sensor. The CZMIL (Coastal Zone Mapping and Imaging Lidar) was developed by Teledyne Optech (now Teledyne Geospatial) in cooperation with the United States’ Joint Airborne Lidar Bathymetry Technical Center of Expertise (JALBTCX). With its strong laser pulse and advanced photon detection technology, it achieves the greatest depth penetration on the market. Integrated into the SuperNova are an Applanix POS AV GNSS & IMU for precise positioning and a PhaseOne 150 megapixel RGB camera.
Planning for the ALB survey
The depth results that can be obtained during an ALB survey range from a couple of metres to about 60m, depending on the capabilities of the sensor used, the bottom reflectivity and the water turbidity. If water is turbid, there are more particles in the water that scatter and absorb light, preventing the laser light from returning to the sensor to provide a depth measurement. In these conditions, the ALB sensor may be unable to detect the bottom beyond a few metres. As water turbidity has considerable local and temporal variation, it is important to take this into account when planning an ALB survey.
The highest turbidity in the survey area was in the Ebro river delta. Summer is generally the driest time in Catalonia, with less river runoff and therefore less sedimentation in the Ebro delta. Available satellite imagery confirmed that turbidity was lowest in the summer, and so the ALB survey was planned for execution in this period.
Further preparations consisted of obtaining flight permits, flight plan optimization, sensor installation and a topographic and bathymetric calibration survey.
Survey execution
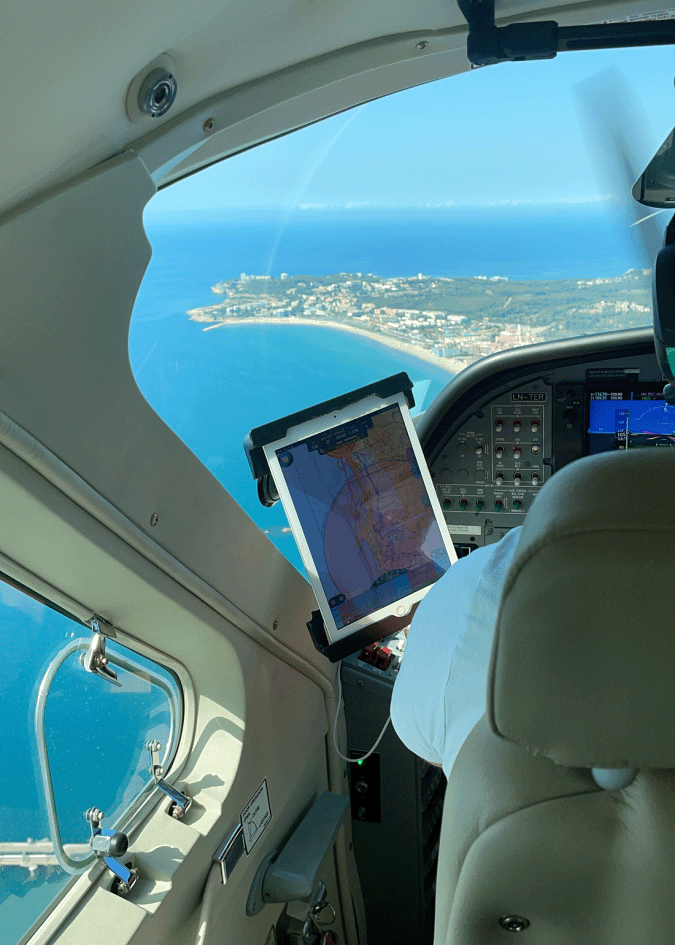
Figure 1 is a picture taken from Field’s aircraft flying over Catalonia. The ALB survey covered about 300km2 and was executed in 12 days. With a total 42 hours of data acquisition for two to five hours a day, about 7km2/h were covered. Note that it would have taken several months for the same survey executed by shipborne sonar.
A requirement from ICGC was an initial survey flight with test lines in the turbid Ebro delta, to assess the obtainable depth results. Apart from an area in the south-west that was too turbid, the results were very positive as 10m depth was reached in most of the area. This was no doubt thanks to the CZMIL SuperNova sensor. Based on the test results, ICGC decided to continue surveying the rest of the Ebro delta, resulting in a topobathymetric elevation model conforming to the 10m depth requirements.
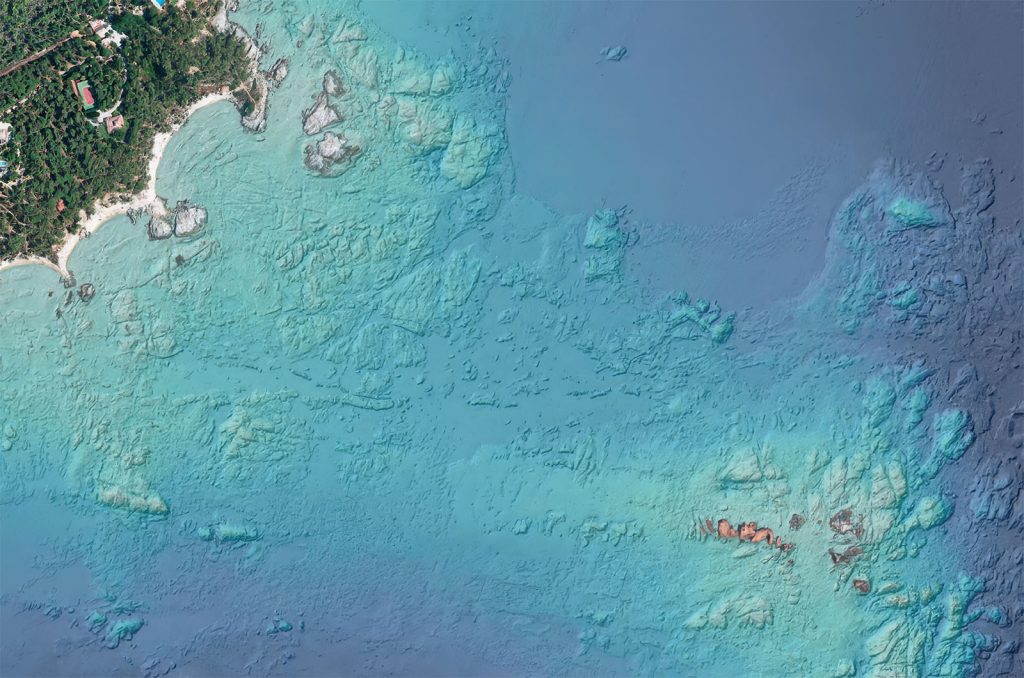
In the other, less turbid areas along the Catalan coast, the SuperNova had no trouble obtaining full bathymetric coverage to the required 10m depth. In many areas, full coverage down to 25–30m was reached, with maximum water depths of around 35m. Figure 2 provides a visualization of the bathymetry around the Formigues Islands in northern Catalonia, with depths greater than 30m represented by the deepest shade of blue.
Local differences in the obtained maximum depths can be partly explained by turbidity, but also local bottom reflection: in general, lighter sandy bottoms reflect light better than dark bottoms or areas with a lot of vegetation.
Data processing
Field processed the ALB data with CARIS, using automated processes and deep learning algorithms to make an initial classification of pulse returns as land, water surface or water bottom. Terrasolid software was then used for further classification, flight line matching and conversion from ellipsoidal heights to the local elevation level used in Catalonia.
The result was a clean and accurate topobathymetric point cloud. While the requirement was at least two points per square meter, the resulting dataset contained more than five points per square meter up to 10m depth in most areas. Point density decreases with increasing water depth, but there were still 2–5 points per square meter at depths of 15–20m. Digital terrain models and depth contours were derived from the point cloud data and were part of the deliverables.

In addition, about 10,000 high-resolution RGB images were acquired and derived orthophotos were created. The land area was overexposed during the image processing, which gave a good view into the water and is useful for habitat mapping. The imagery colors were also added to the Lidar point clouds.
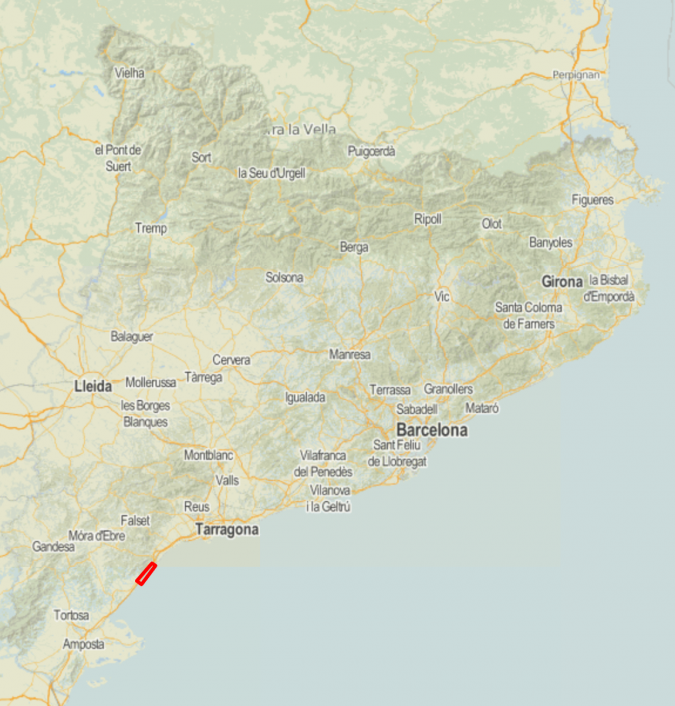
Figure 3 shows the point cloud of an example area around the Vandellòs nuclear power plant. The map indicates with red the location of this area along the Catalan coast.
The water surface has been removed so that the bathymetry is visible. This is a full topobathymetric model to about 22m depth (not cut off by the depth extension of the sensor but by the area to survey). The first image shows the point cloud colored based on the orthophoto. The second image shows the same point cloud based on classification. By using several customized algorithms to distinguish between bottom returns and marine vegetation, Field is able to classify both of them separately. This can be seen in the image with bathymetry in blue and marine vegetation in dark green.
Survey results
ICGC was pleased with the quality and detail of the resulting datasets, such as the submarine discharge outlets along the coast that were seen in the data and the remains of an old lighthouse found underwater in the Ebro delta. An added advantage of the short and efficient coastal zone survey using ALB is that the resulting dataset is more homogeneous and coherent than surveying several patches over longer or multiple periods using sonar.
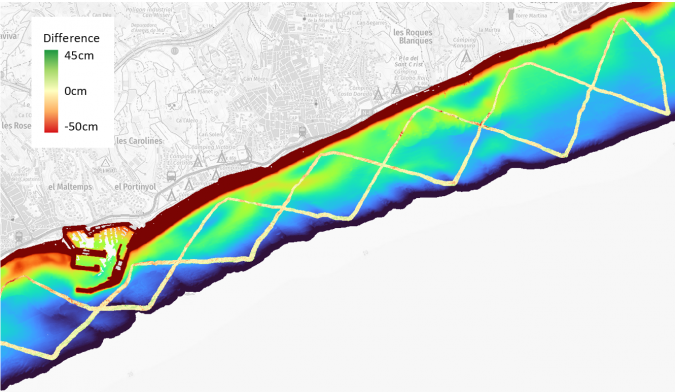
To check the accuracy of the survey, Tecnoambiente surveyed a test area using multibeam sonar. Figure 4 shows the 0–10m bathymetric Lidar data and the pattern of the multibeam sonar survey, coloured according to the difference between the two datasets. In the white/yellow area, the difference is not more than a few centimetres. The average root-mean-square (RMS) difference value between the datasets was 12cm, which was well within the requirements. Differences are generally larger in the shallows than in deeper areas, which can be explained by the five-month gap between the two surveys as well as the water bottom being more dynamic in the shallow area.
In general, the results confirm for ICGC that ALB is the best technology for surveying the Catalan coastal zone, and it will probably be used more often in the future, for example to monitor changes.
Subsidy note
This project executed by the Catalan General Directorate of Environmental Policies and the Natural Environment of the Department of Climate Action, Food and Rural Agenda is co-financed by the European Maritime and Fisheries Fund and the Department of Climate Action, Food and Rural Agenda.
Next steps
ICGC will continue working on the delivered products and create a seamless topobathymetric model for the whole of Catalonia, integrating the newly acquired ALB data with existing topographic Lidar data and the multibeam sonar bathymetry for the deeper areas. This integrated elevation model will serve as a baseline for many purposes, such as modelling the stability of beaches with different scenarios of sea-level rise and an increase in the number of storms.
It is therefore an important resource for researchers, policymakers and other stakeholders in supporting decision-making processes for the sustainable management of the Catalan coastline and marine environment.


 In a time of storms: Mapping crucial coastal zones with advanced bathymetric imaging
  Getting the Big Picture